
Fidelity Perspectives: Looking beyond the noise on market volatility
What’s been driving market volatility?
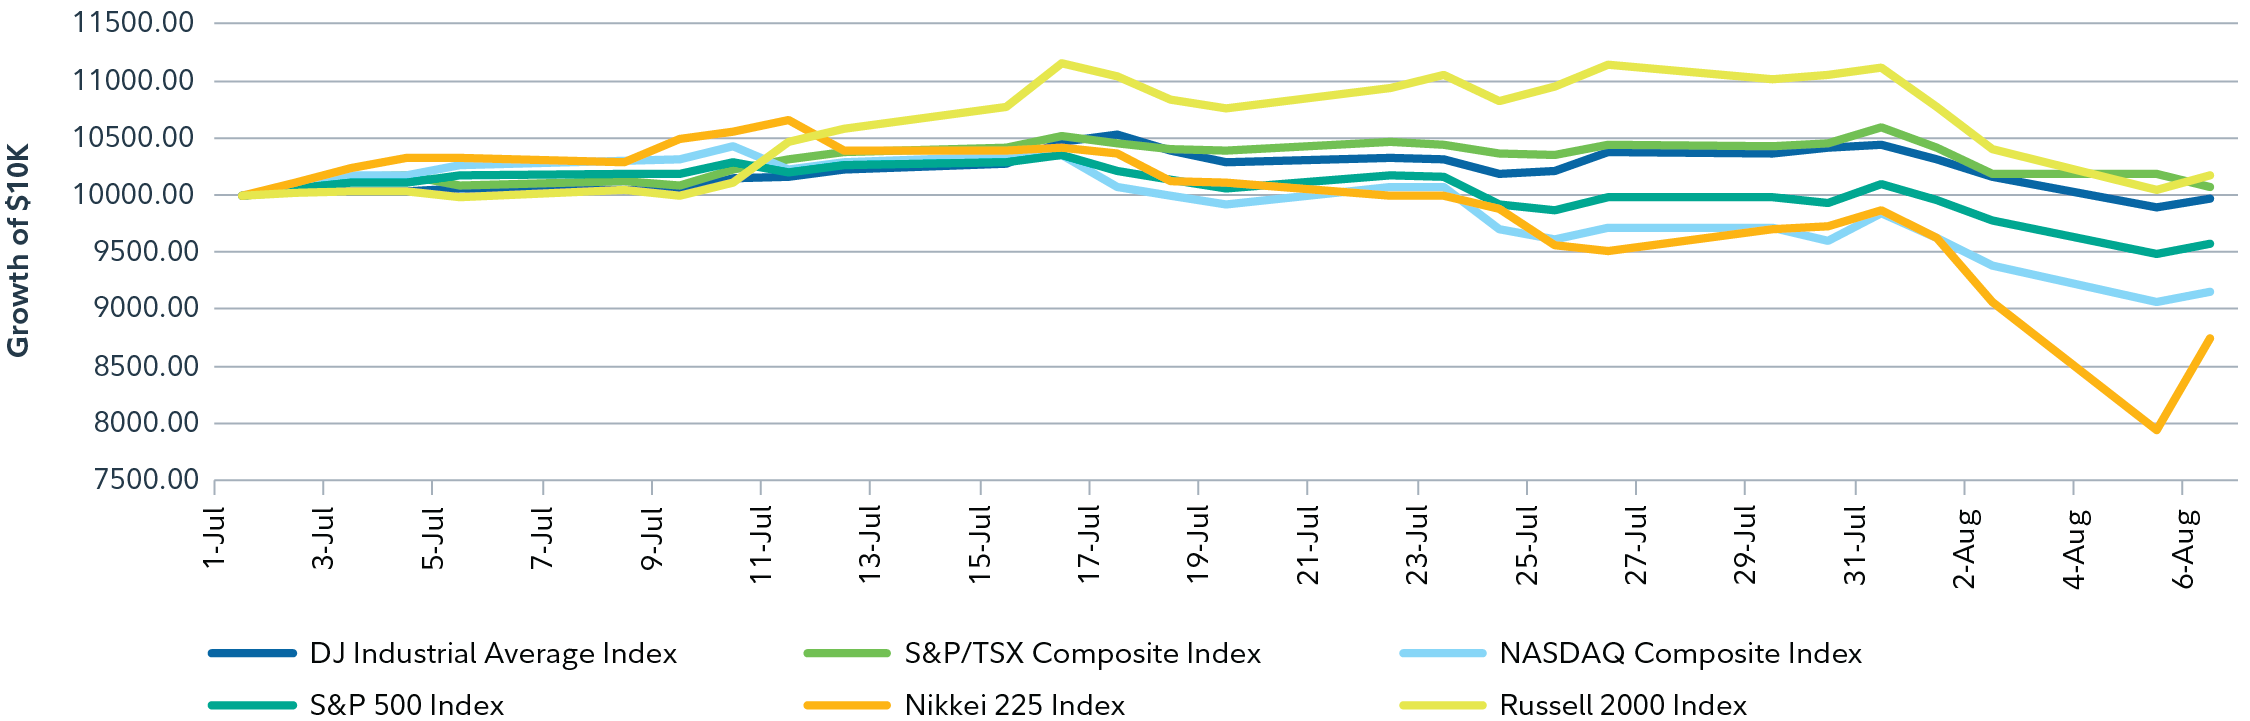
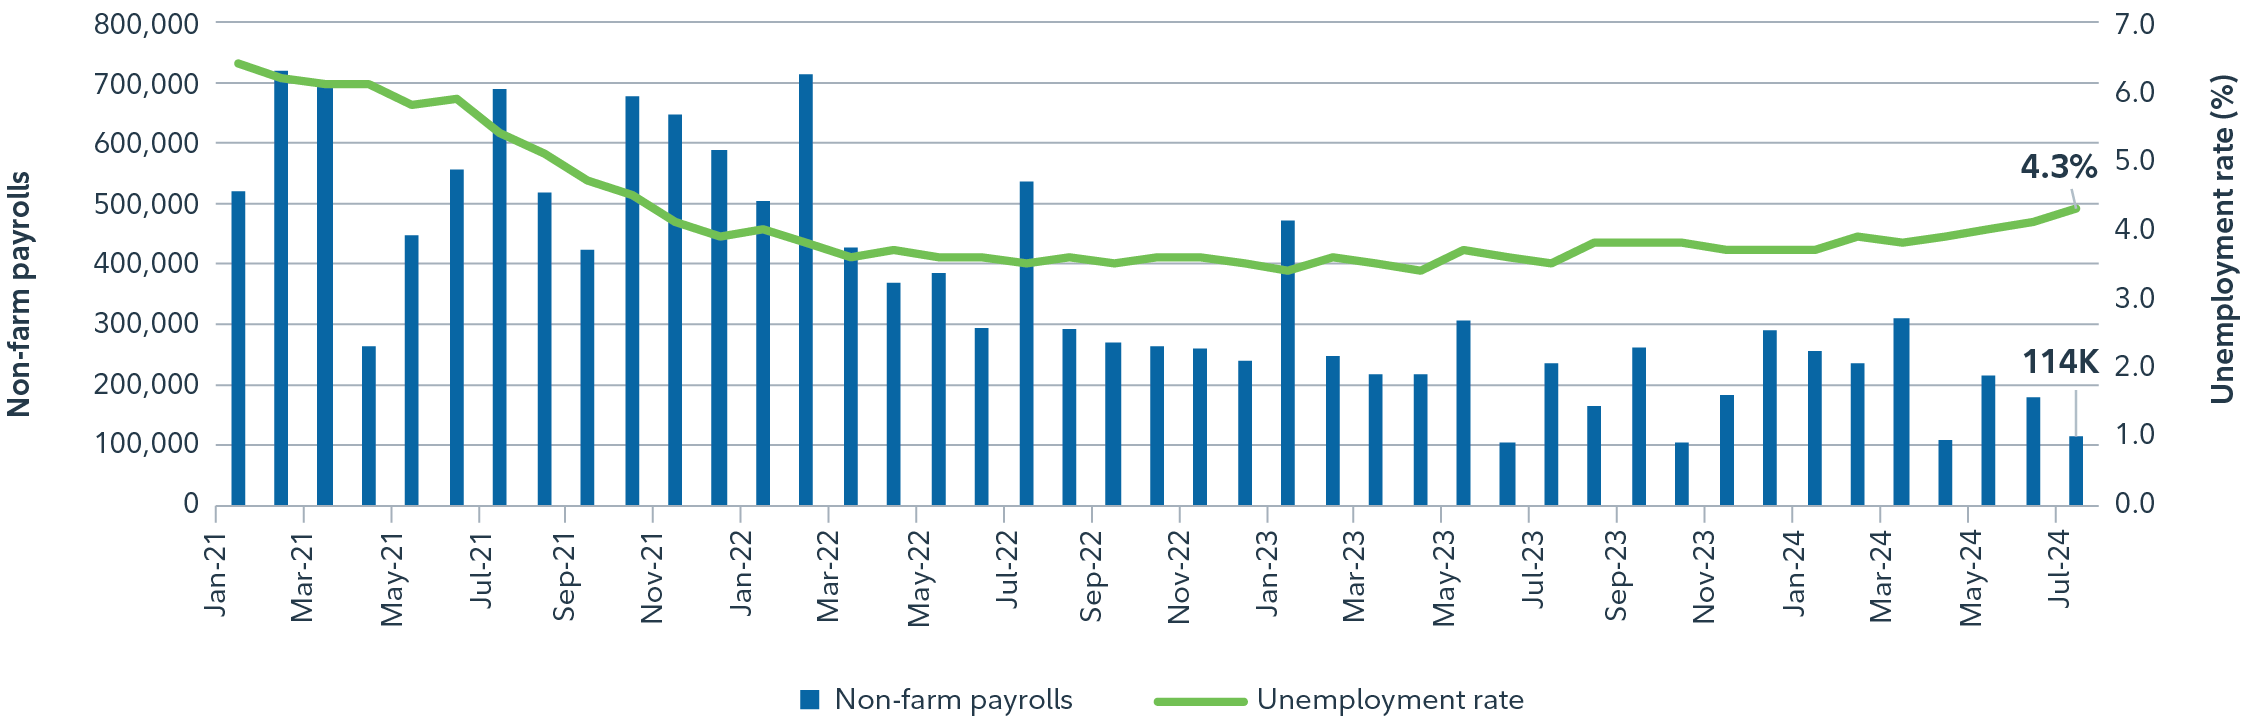
Recently market volatility has intensified following softer U.S. economic data, particularly the weaker non-farm payroll report released on August 2. Over the month of July, market participation broadened, with investors shifting away from U.S. large caps (S&P 500 Index) into U.S. small caps (Russell 2000 Index). However, the spread narrowed as volatility amplified in the market, causing equity risk appetite to falter across the board.
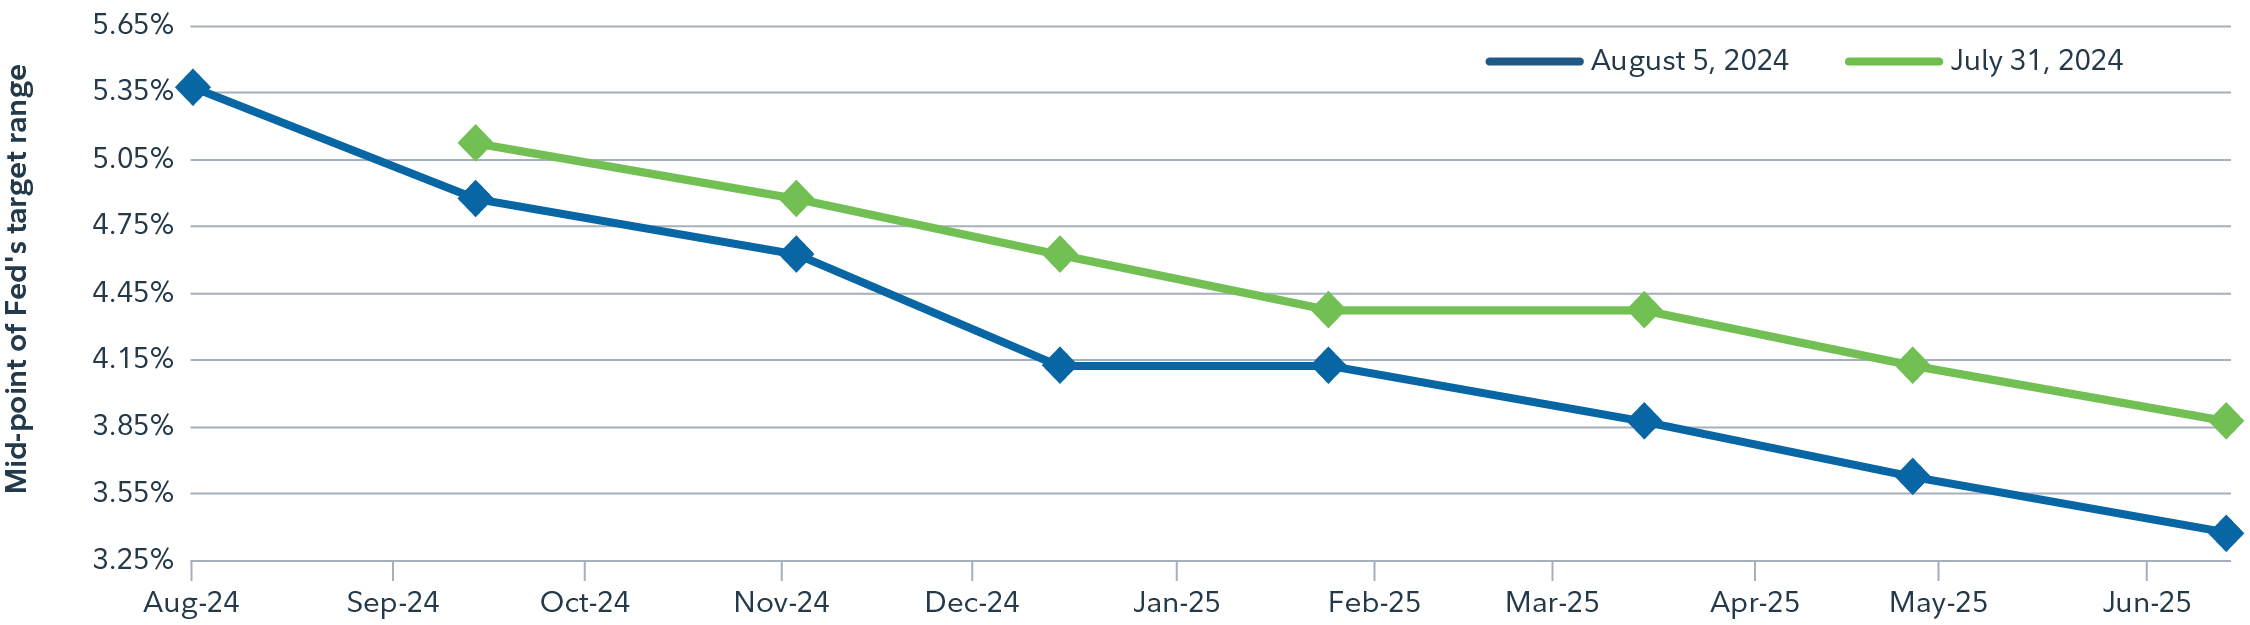
The downturn in U.S. data has heightened market concerns about a potential recession, with the probability of rate cuts rising significantly. Markets are now pricing in a cut of 50 basis point (bps) in September instead of the 25 bps expected earlier (as at the time of writing). Increased speculation about potential emergency cuts has emerged in response to the sharp equity sell-off.
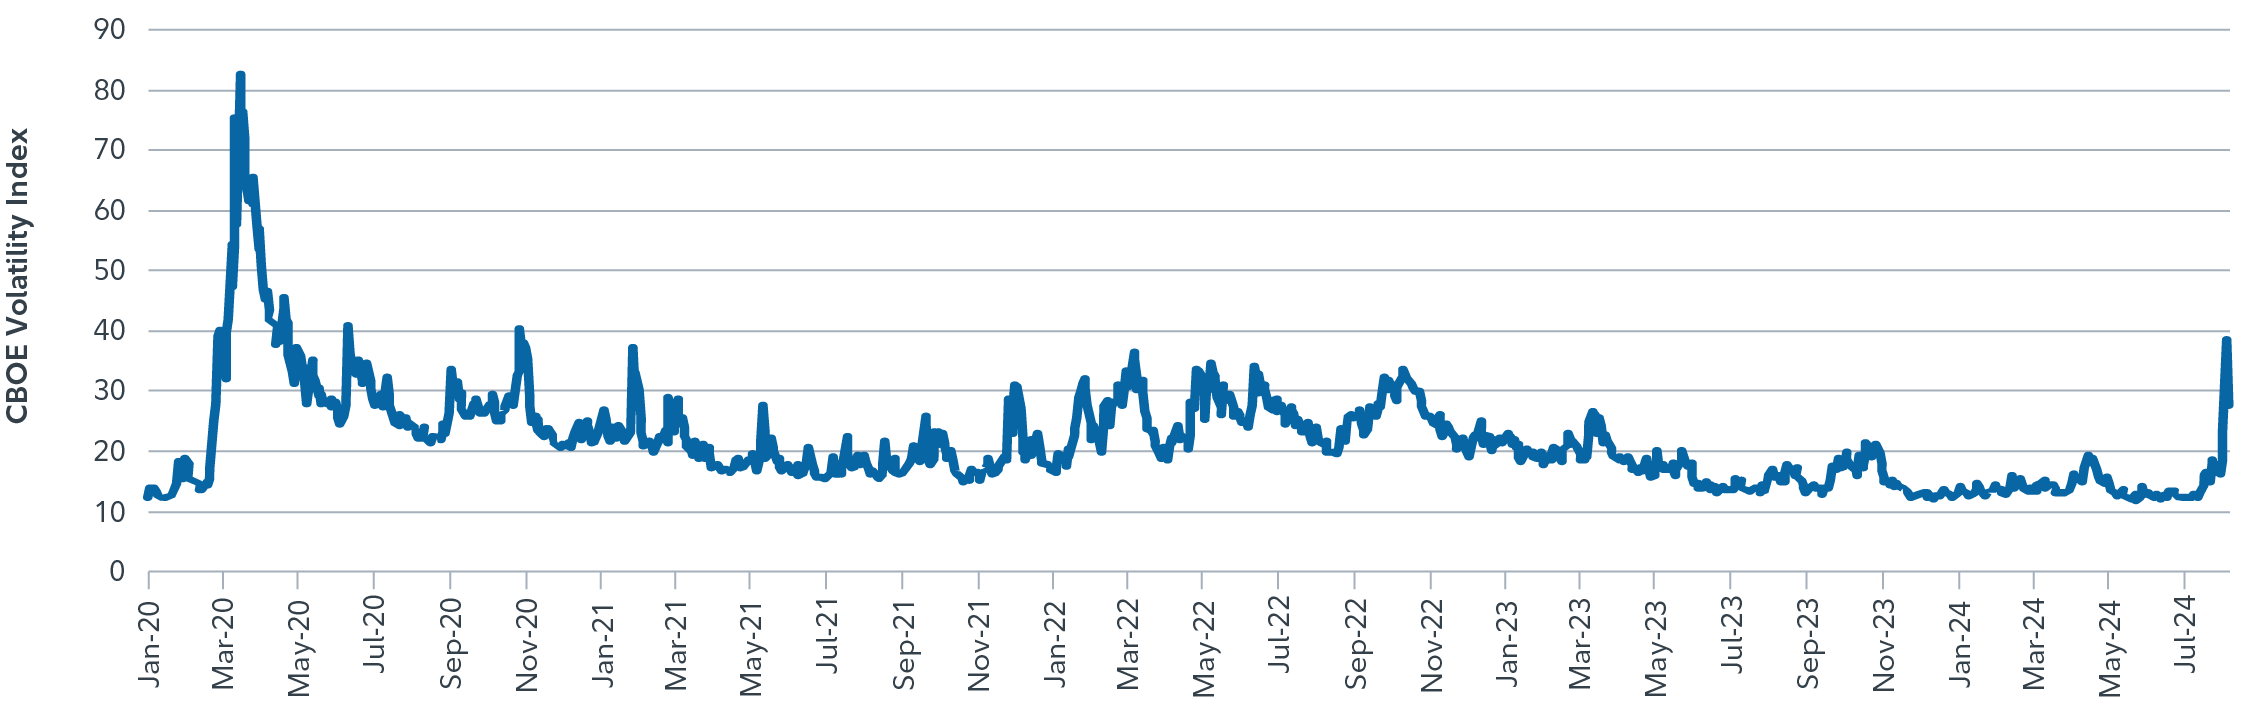
The turbulence follows a hawkish move by the Bank of Japan, which increased rates by 25 bps, in stark contrast to dovishness elsewhere around the globe. Consequently, the interest rate differential between the U.S. and Japan narrowed significantly, pushing the U.S. dollar-yen exchange rate lower. This triggered a swift exit from highly leveraged carry trades, with investors liquidating higher-yielding assets to buy back yen. While some degree of carry unwinding was anticipated due to recent dovish comments from the U.S. Federal Reserve (the Fed), its rapid pace over the few days leading to August 5 certainly came as a surprise to the market, driving heightened market volatility to levels last seen during the pandemic downturn in 2020 (see chart 2).
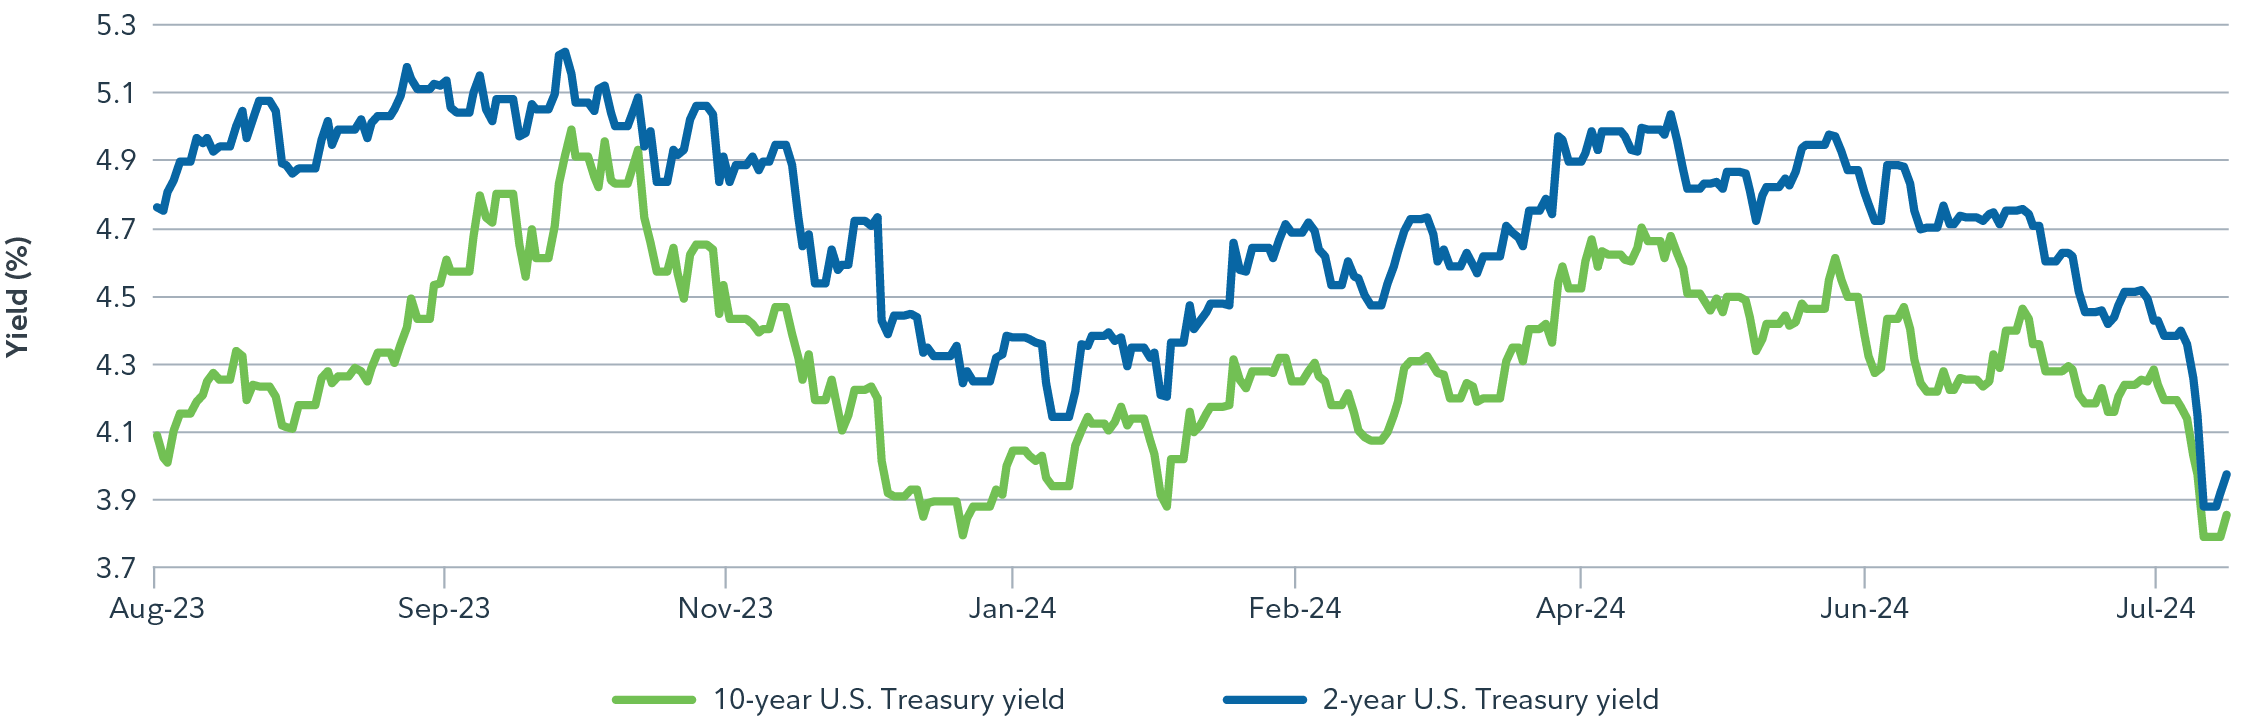
There are good explanations for the soft U.S. jobs data and ensuing market rout. Markets have reacted strongly to recent data that suggest further weakening in the U.S. labour market. Global stocks have had a volatile start to August, while U.S. Treasury yields fell.
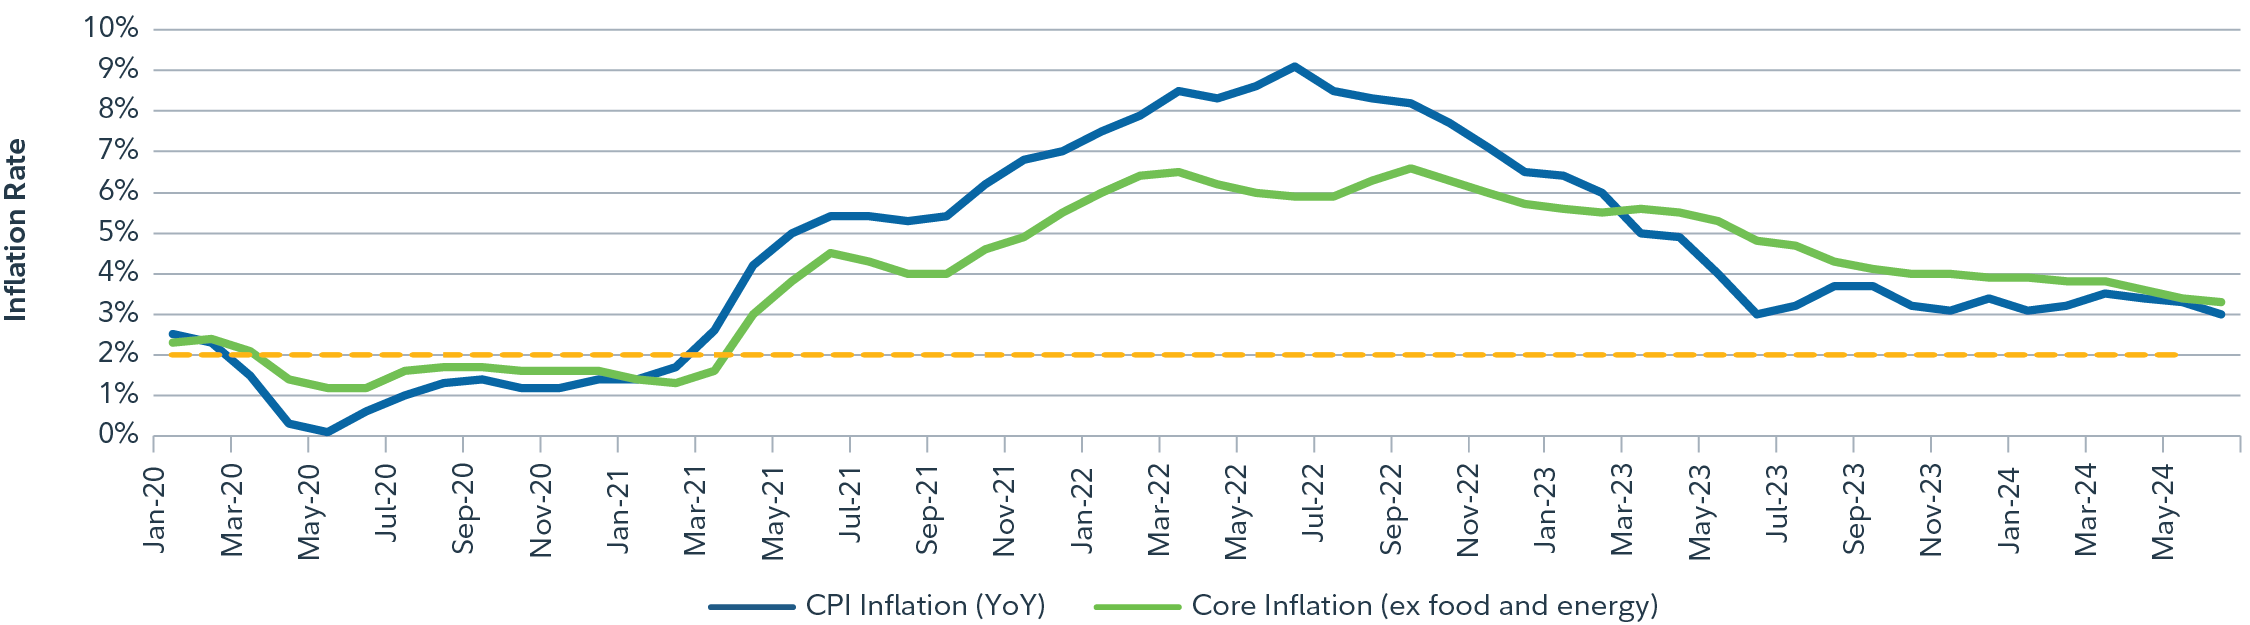
These price moves reflect growing fears that the jobs data signal an imminent recession in the U.S. The uptick in unemployment over July can be largely explained by the supply of labour, reflected in the higher participation rate (that is, more people of working age either in employment or looking for work). Moreover, the report showed a large number of temporary layoffs, which has the potential to reverse in the coming months. Consequently, the employment-to-population ratio, particularly for prime age workers, remains steady. But markets are concerned, especially after a slowing in the pace of economic growth and a broad-based easing in price pressures.
How will the Fed respond?
Volatility is not necessarily a harbinger of recession. Until the week of August 2, markets expected the Fed to cut interest rates by 25 bps in September and in December. The severity of risks now emanating from financial markets could warrant a strong central bank response. That means there is the possibility of more frequent and bigger cuts (up to 50 bps), were financial conditions to tighten further. The Fed could release an official statement to quell immediate market concerns, saying it is watching developments closely and stands ready to act if market turmoil starts to affect liquidity and the outlook for monetary policy.
The following are the views from various Fidelity portfolio managers and subject-matter experts who have weighed in on the recent volatility.
| David Wolf and David Tulk |
|---|
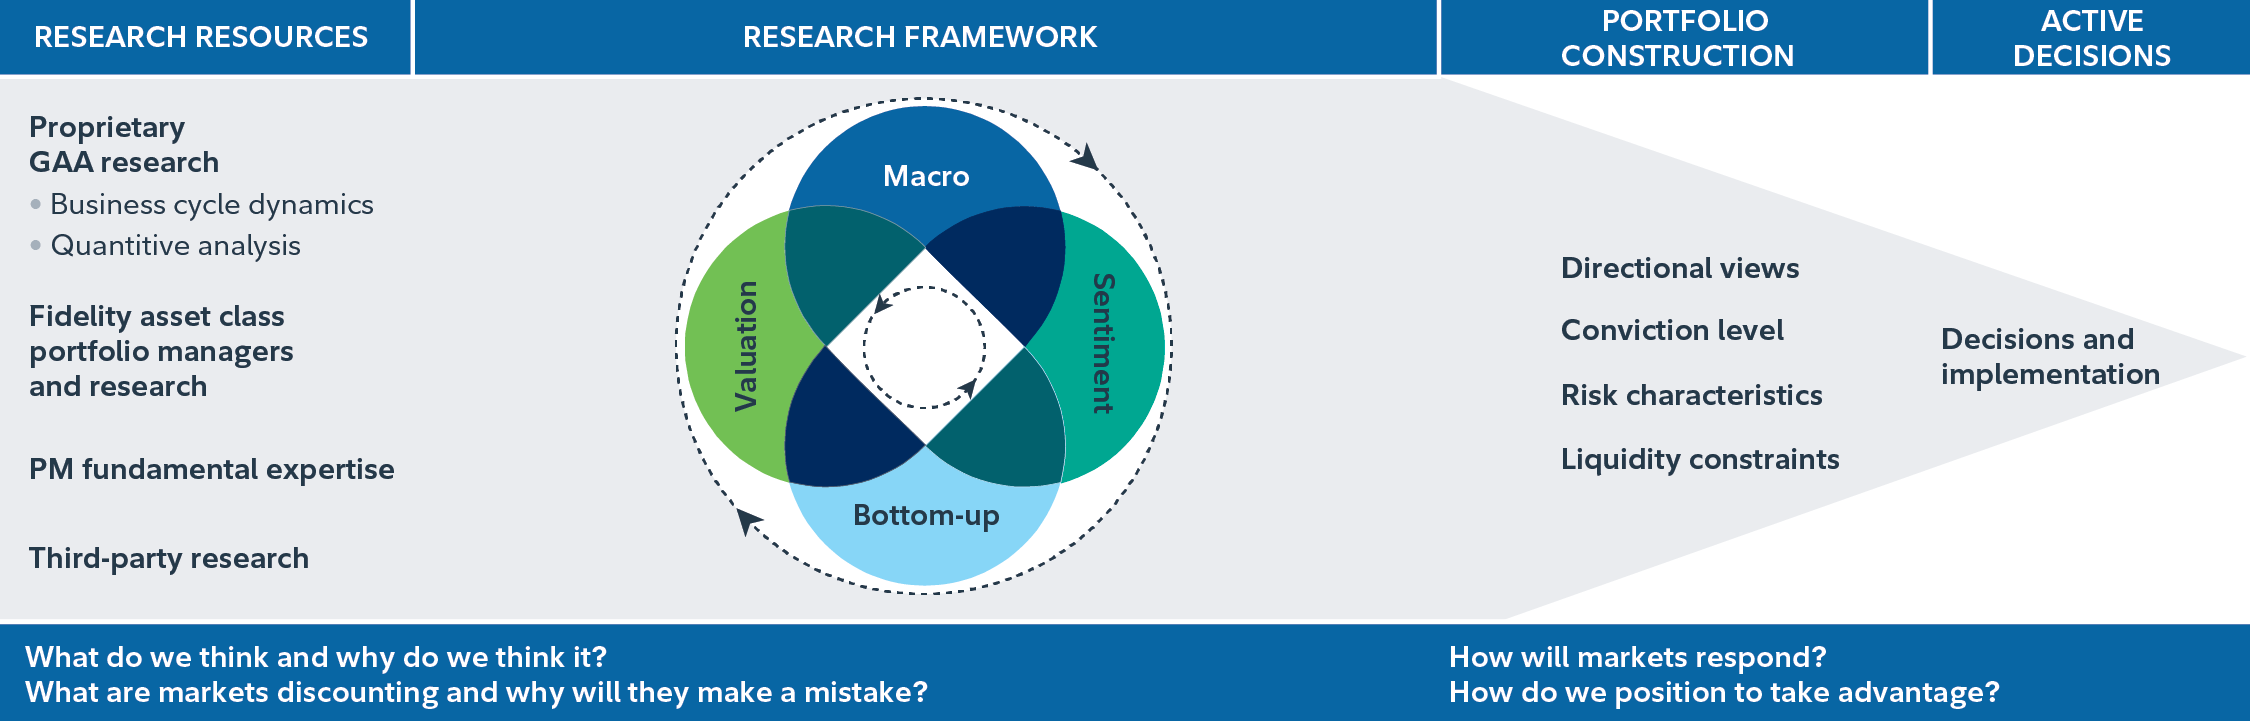
Portfolio Managers David Wolf and David Tulk note that recent volatility was likely exacerbated by stretched market positioning in the information technology sector, a rapid unwinding of foreign exchange positions following an expected weakening in the Japanese yen, and limited seasonal liquidity. Despite being well covered, these events have caused fear in markets. Events like these serve as a reminder to continue focusing on the managers’ four-pillar research-based investment framework. One of the pillars of this deliberate framework is sentiment; in practice, this means taking advantage of market fears rather than indulging them. The managers of the underlying funds that David Wolf and David Tulk prefer as building blocks also do this: they look for buying opportunities when sentiment regarding securities in their funds is overly negative. David Wolf and David Tulk do not believe that the risk of a U.S. recession has increased dramatically over the past week. The most recent statement from the Fed acknowledged a softening in the labour market and a greater confidence that inflation was moving sustainably toward 2.0%. The Fed’s choice to highlight not only the progress on inflation but also the slowing in the labour market suggests that policy rate normalization could likely begin soon, and that would provide slightly easier financial conditions heading into the end of the year and 2025. |
More broadly, the managers emphasize diversification in the structure of their portfolios so that they are resilient to these kinds of shocks over the medium term. The recent market events highlight how critical the research-based framework is in achieving this goal.
| Adam Kramer |
|---|
With investors facing an unpredictable economic and political landscape, Portfolio Manager Adam Kramer is remaining patient and looking to take opportunistic advantage of asset class mispricing. In a year marked by a highly consequential U.S. election and a global economic environment riddled with uncertainty, the best course of action, according to Adam, is to avoid making outsized asset class bets while awaiting more clarity. In helming his flexible income-oriented strategy, Adam dynamically pursues attractive income and value opportunities across a wide variety of asset classes, ranging from investment-grade bonds to dividend-paying equities, where temporary mispricing often causes investors to overreact to fear or uncertainty. Adam is always aware of where we are in the cycle and looking for asset classes that have too much bad news priced into them. He believes that his investment process has a repeatable and duplicable aspect, given that the income-oriented asset classes tend to take turns each year as either the best or worst performers, only to shift the following year, as shown in chart 8 |
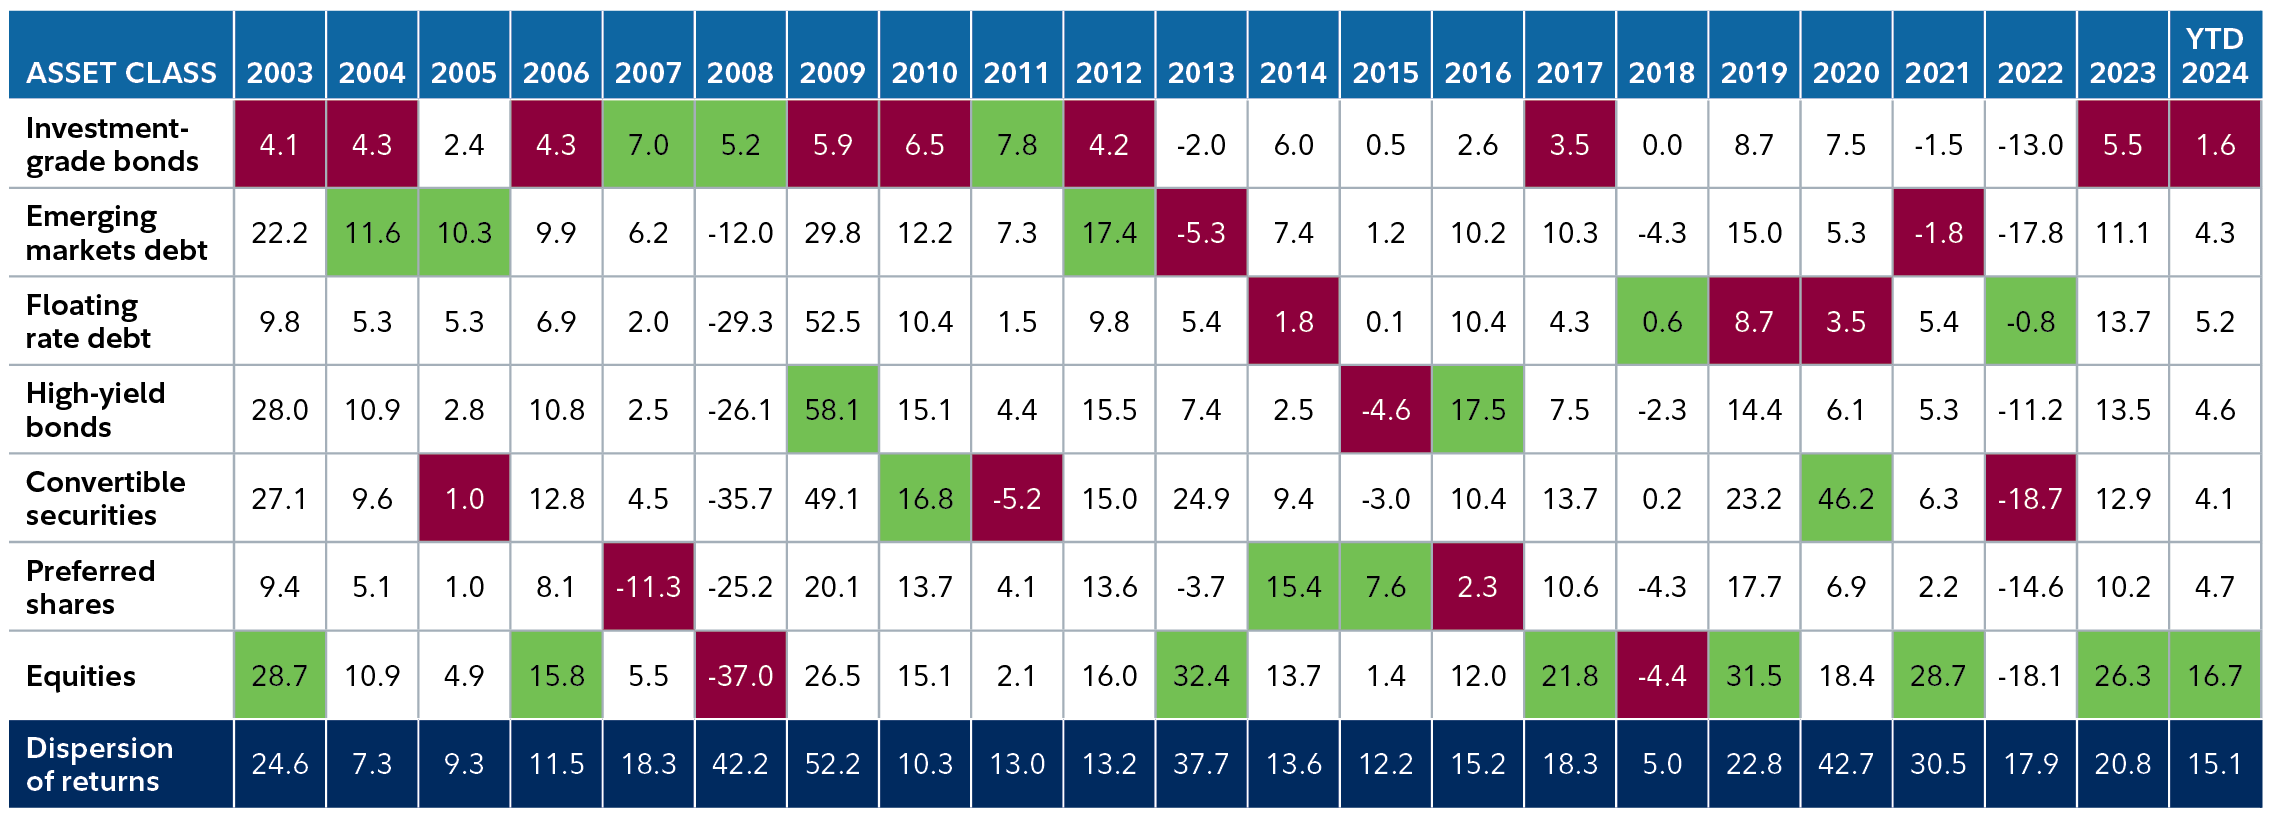
This rotation of asset class leadership occurs because the market prices in credit, earnings and interest rate risk well before actual events occur. So each year, no matter what the big-picture narrative is, Adam notes, there is always an opportunity to seek value, income and natural volatility dampeners; this is a feature that differentiates his investment process from others. Against an inherently volatile backdrop, Adam continues to stick to and trust his investment process, while waiting for the market to price in risk – either rightly or wrongly – and then invest accordingly.
| Michael Plage and Jeff Moore |
|---|
Fixed income portfolio managers Michael Plage and Jeff Moore note that cracks in the U.S. labour market are starting to open, and the Fed is starting to take notice. The July non-farm payrolls report was soft across the board, with weak labour demand, narrow breadth of hiring, slowing labour income and a rising unemployment rate. While there are reasons to believe the weakness in the July report may be overstated, the narrative seems to be shifting away from the benefits of a falling inflation rate to the fear of a deteriorating labour market and a slowing economy. Both scenarios would result in the Fed lowering its target rate, and the odds of a September cut are now fully priced in by market participants. However, for the Fed to cut as a “mid-cycle adjustment,” or to become less restrictive, is dramatically different than easing to stimulate the economy because it detects weakness. We will understand in coming months if the Fed is behind the curve, but as Fed Chair Jerome Powell has communicated on several occasions, the Fed has the tools and knows how to cut very quickly if it thinks it is necessary – and the market is starting to increase the odds that it will be. The managers also note that the U.S. presidential campaign season is also about to heat up. Positioning portfolios for specific political outcomes is generally not a winning strategy, but taking advantage of market volatility created by political narratives can be. For Michael and Jeff, the key to navigating these periods of heightened uncertainty is to rely on their multi-disciplined, proven, five-step process and to trust in their robust bench of experienced teammates, who know their jobs and have invested opportunistically, calmly and profitably through many cycles. |
| Will Danoff |
|---|
Portfolio Manager Will Danoff notes that recent market volatility provides an opportunity to reinforce long-term convictions, rather than make a reactionary shift in strategy, because he considers the pullback to be based more on technicals than on fundamentals. The economy remains robust, and his portfolio’s larger-than-benchmark positions in market-leading companies continue to show strong fundamentals. The market, trading at 17.8 times next year’s earnings, is relatively cheap, in his view, especially with declining interest rates and inflation. Notably, top portfolio names are now more attractively priced and have held up relatively well amidst significant selling in major market indexes. Will’s strategy favours large-cap tech companies, due to their leading earnings growth and strong cash generation. Instead of repositioning defensively, Will’s focus is on leveraging volatility to strengthen long-term positions in market leaders. He views the current market turbulence as a short-term correction within a longer-term bull market. While there may be more choppiness due to seasonal factors, the election and interest rate uncertainties, the overall market remains strong, with improving corporate earnings. The portfolio’s performance has been strong throughout the year and has remained relatively resilient amidst recent market uncertainties. |
| Mark Schmehl |
|---|
Portfolio Manager Mark Schmehl notes that increased volatility in markets has been driven by a confluence of changing expectations regarding economic growth in the U.S., interest rates and mega-cap technology earnings, which has been exacerbated by the unwinding of a crowded trade. Despite the recent softer U.S. economic data and broad-based easing of price pressures, the Fed has yet to engage in policy interest rate cuts of the sort we have already seen from other global central banks. Against this backdrop, Mark is emphasizing the need to size risks and positions carefully; he believes that understanding the fundamentals of companies, to ensure that they have strong earnings, and discerning each holding in the portfolios are crucial in Mark’s view. In the technology space specifically, Mark is being selective, emphasizing companies with durable and secular growth tailwinds. Mark believes adaptability is key in managing the portfolios while navigating periods of market volatility, which are a natural part of equity investing. Mark’s investment strategies are flexible by design, seeking opportunities in the two tails of the market. In recent years, Mark’s portfolios have been biased toward the right tail, given the prevalence of opportunities there, but in the past, there have been periods when Mark was more biased toward the left tail. This flexibility has been crucial to the success of his portfolios over the years. For instance, Mark found good opportunities in fertilizers (2007), regional banks (2009–2010) and more. Because markets can turn quickly, Mark wants to be ready to buy stocks he likes when the opportunities arise. Accordingly, he maintains an open mind, and will not hesitate to change his positioning if market conditions change. |
| Dan Dupont |
|---|
Portfolio Manager Dan Dupont’s view on the recent market volatility reflects a strategic approach focused on downside protection and exploiting opportunities that arise from market dislocations. The recent volatility was seen as a beneficial correction, addressing high levels of complacency in momentum trades and arbitrage. This short-term spike in volatility allowed for selective exploitation of dislocations that were available in the fund’s opportunity set. In terms of portfolio positioning, Dan maintains a defensive stance, exploring opportunities in areas of cheapness in global markets, as well as Canada. Dan’s strategy involves staying vigilant about market conditions and making necessary adjustments to maintain a defensive posture, focusing on long-term objectives while managing short-term risks. This disciplined approach ensures the portfolio remains resilient through market uncertainties and is aligned with the goal of enhancing risk-adjusted returns over time. |
| Steve Dufour |
|---|
Steve Dufour, Portfolio Manager of Fidelity U.S. Focused Stock Fund, believes that even though short-term volatility is challenging, it presents a valuable opportunity to prune weaker positions and upgrade the Fund’s long-term holdings. As the market broadens and the location of earnings growth evolves, the Fund aims to capitalize on uncertainty and position itself for future benefits. The economy remains robust, and the Fund focuses on companies delivering strong relative earnings growth, with market-leading fundamentals. Rather than repositioning defensively, Steve seeks to leverage volatility to enhance long-term holdings in earnings growth leaders. Uncertainty often highlights the strongest names, which maintain their resilience due to robust fundamentals amidst broader market selling. |
| Darren Lekkerkerker |
|---|
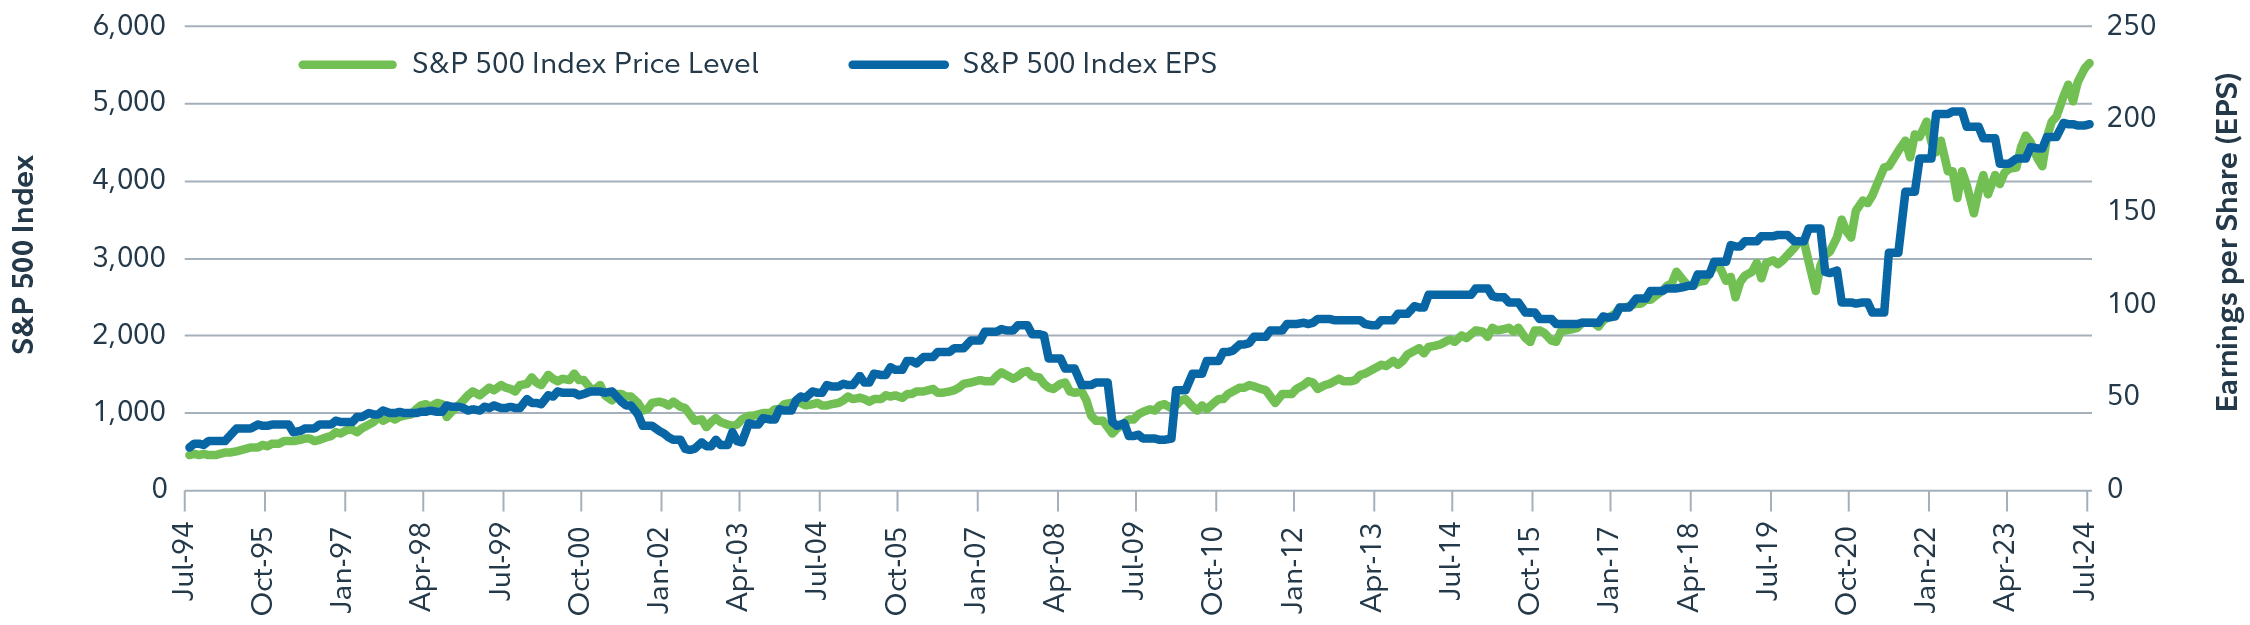
Portfolio Manager Darren Lekkerkerker notes that short-term market volatility is a natural part of equity investing, and that over the long term, equity markets have historically followed earnings to higher levels, as shown in chart 9. Darren also notes that attempting to forecast market movements is quite a difficult task; he prefers to focus on high-quality companies that may be more resilient in uncertain market backdrops, and which may also eventually be stronger compounders. In Darren’s view, the high-quality names that make up his portfolios are well positioned for the long-term compounding of earnings, because they tend to have more stable demand, pricing power, resilient margins and strong balance sheets overall. Accordingly, while he continues to monitor the macroeconomic environment, he remains focused on ideas driven by bottom-up fundamentals. |
Specifically, Darren has been finding ideas in the industrials space, particularly among aerospace names, which in his view stand to benefit from cyclical and secular tailwinds: as global economies recover and grow, the demand for air travel will likely increase, thus driving demand for new aircraft, and new supply is currently limited by long backlogs. From a secular standpoint, global economic growth and urbanization should also support demand for air travel over the longer term; as more people join the middle class and can afford air travel, this should lead to a steady increase in passenger volumes. In Darren’s view, the combination of these factors should support sustained earnings growth for the group.
Among commodities, Darren notes that in the first half of 2024, resources have reflected a complex interplay of supply, demand and macroeconomic factors. Darren continues to prefer copper, given that supply remains extremely tight for this long-cycle resource, where it takes years to build significant volume. Darren also believes that the energy transition toward renewables, which has continued to pick up pace, will consume more copper in the future. On the energy side, uranium is an area that Darren has been finding attractive, due to its role in nuclear power generation, which is increasingly being reconsidered as a viable option for clean energy production. Darren notes that nuclear power is a more stable source of power than other sources of clean energy, and the supply of uranium globally is short, thus providing a supportive demand/supply backdrop for the resource over the medium to long term.
What’s happening with crypto?
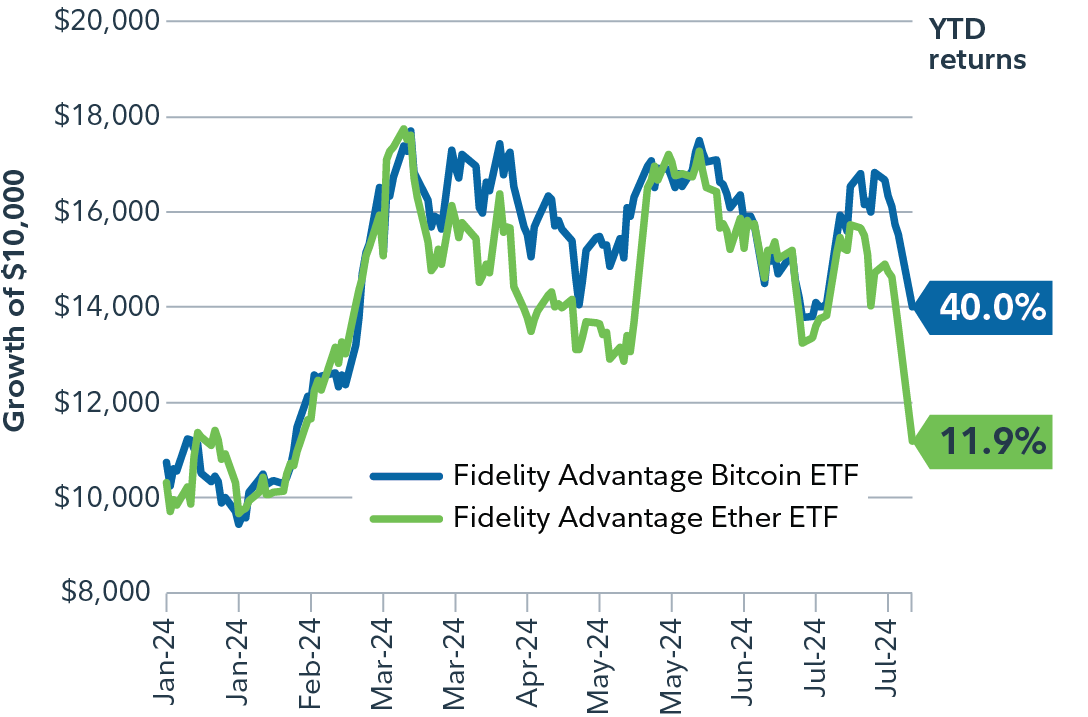
Portfolio Manager and Director of Research Reetu Kumra notes that despite the recent turmoil, bitcoin (BTC) and ethereum (ETH) have shown notable year-to-date increases of 40% and 12%, respectively, as at August 6, 2024. Reetu emphasizes that on a medium-term basis, the crypto ecosystem has benefited from several tailwinds. These include the approval of two spot ETFs in the U.S., increased political support for cryptocurrencies and a macroeconomic environment that favours lower interest rates. Additionally, the “de-dollarization” theme has gained traction, further boosting the ecosystem.
| Strategy | 1 year | Since inception |
|---|---|---|
| Fidelity Advantage Bitcoin ETF | 132.1 | 6.9* |
| Fidelity Advantage Ether ETF | 81.7 | 61.1** |
As at July 31, 2024 in Canadian dollars.
* Fidelity Advantage Bitcoin ETF was incepted on Nov 30, 2021
** Fidelity Advantage Ether ETF was incepted on Sep 26, 2022
A significant development has been the decoupling of bitcoin from traditional risk assets. The correlation between BTC and the S&P 500 Index has decreased from the highs seen in 2021–2022, indicating that bitcoin is starting to behave more like an emerging store of value. This is driven by its network size and growth, as well as prevailing monetary and fiscal policies. Looking forward, bitcoin is poised to evolve further with increased innovation. Developers are exploring opportunities to enhance bitcoin’s scalability and its use as a payment method, although this remains in the early stages.
Despite these positive trends, Reetu acknowledges that the crypto market can still exhibit risk asset characteristics during periods of negative sentiment, as seen during the pandemic and in early 2022. She notes further that it is paramount that investors maintain a medium-term perspective and understand that volatility is an inherent feature of digital assets. Reetu continues to hold the view that a modest allocation of 1%–3% of a portfolio to cryptocurrencies can enhance risk-adjusted returns over the long term.
Time heals all
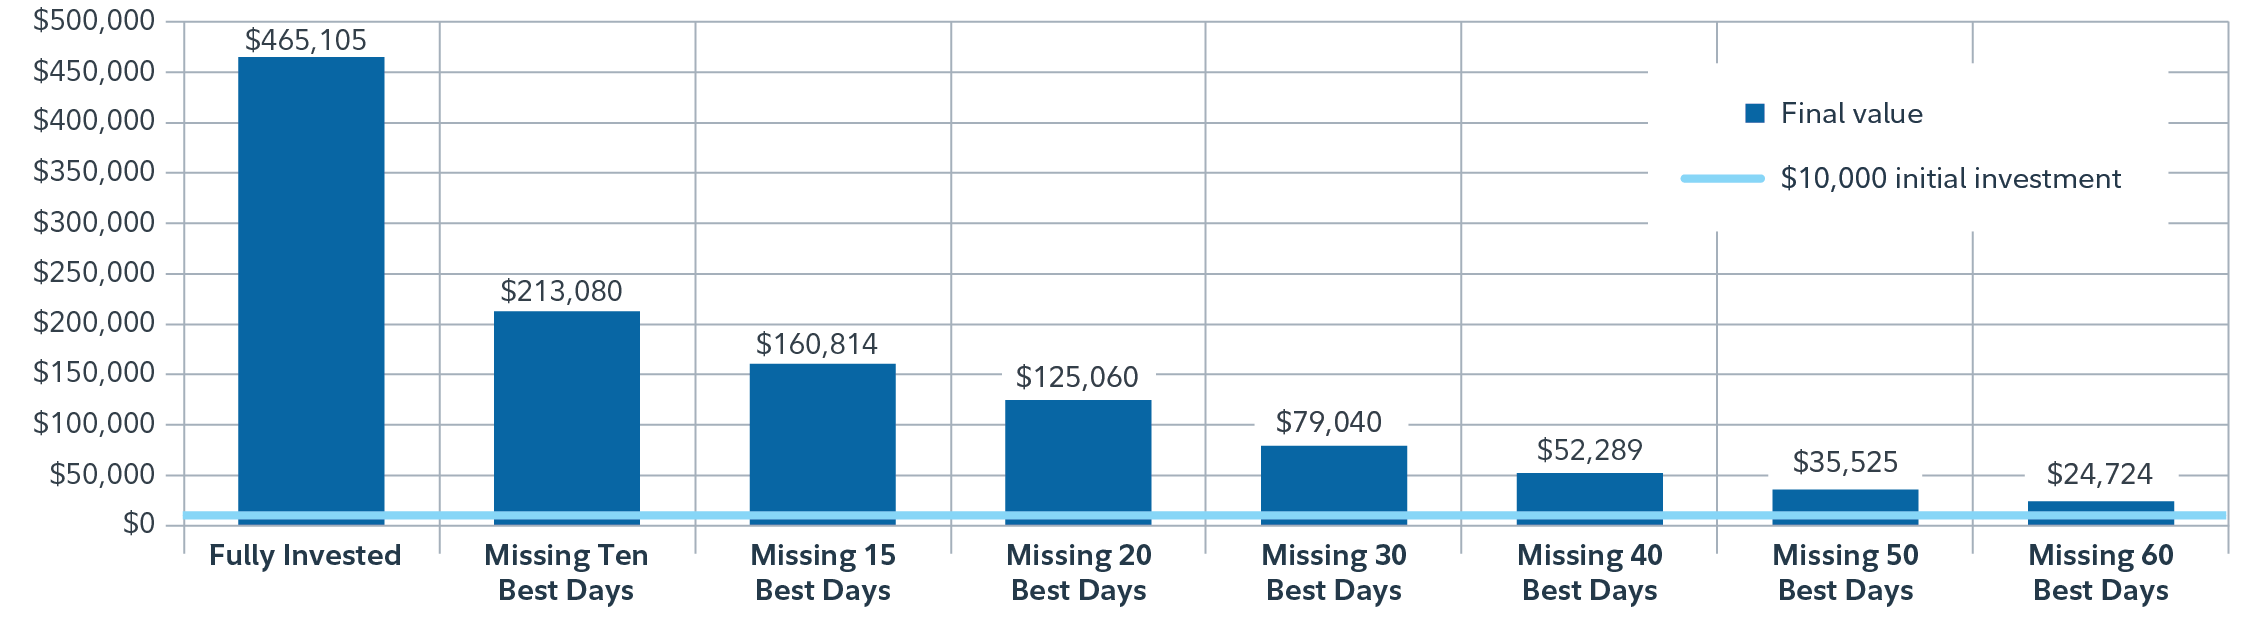
Volatility is a normal part of investing. Despite market volatility, investors should not lose sight of the big picture and their long-term investment goals. Time in the market pays off more than trying to time the market.
Diversification and professional management can help manage short-term risks while pursuing long-term investment goals.
Chart 11: Focus on the big picture – don’t miss out.
Finally, a comparison of the highest and lowest returns for various investment time frames from December 1980 to December 2023 shows that staying invested reduces the volatility of returns, as depicted in chart 12.*
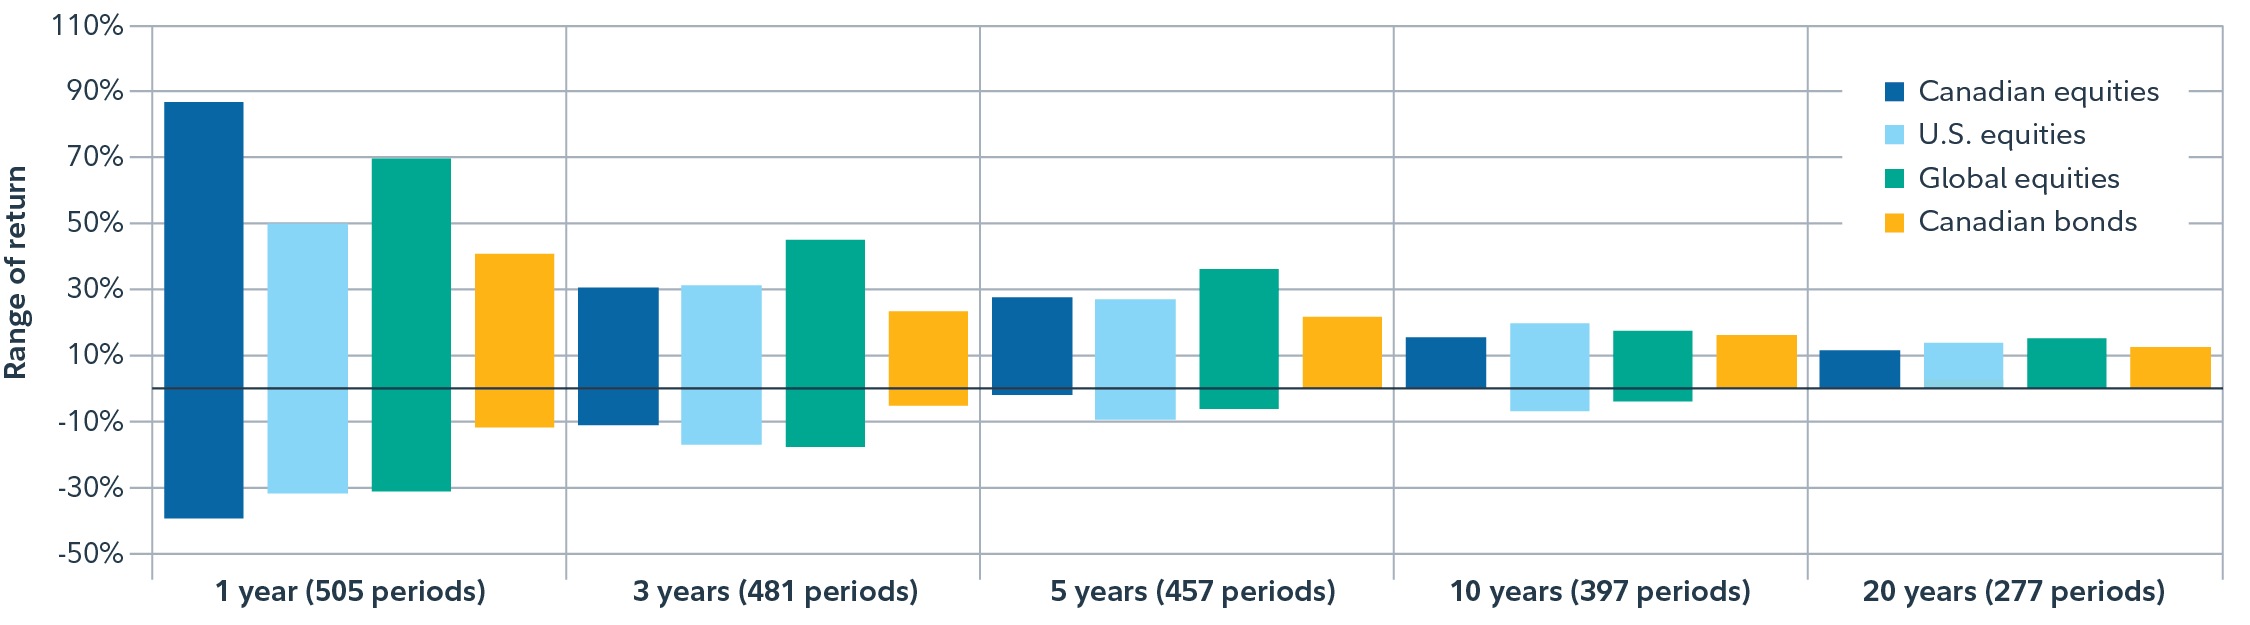
* For example, the results for the one-year investment time frame are based on 505 sample one-year periods: Dec. ‘80 to Dec. ‘81…Dec. ‘22 to Dec ‘23.


